
Uber Overview
- Year Founded
-
2009

- Status
-
Public
- Employees
-
37,300

- Stock Symbol
-
UBER

- Investments
-
117
- Share Price
-
$63.47
- (As of Friday Closing)
Uber General Information
Description
Uber is a technology provider that matches riders with drivers, hungry people with restaurants and food couriers, and shippers with carriers. The firm's on-demand technology platform is currently utilized by traditional cars and autonomous vehicles, but could eventually support additional products and services, such as drone delivery or electric vertical takeoff and landing (eVTOL) technology. Uber operates in over 70 countries and has over 200 million users who order rides or food at least once a month.
Contact Information
Website
www.uber.comCorporate Office
- 1725 Third Street
- San Francisco, CA 94158
- United States
Corporate Office
- 1725 Third Street
- San Francisco, CA 94158
- United States
Uber Timeline
Uber Stock Performance
As of 20-Nov-2026, Uber’s stock price is $63.47. Its current market cap is $130B with 2.04B shares.
(As of Friday Closing)
| Stock Price | Previous Close | 52 wk Range | Market Cap | Shares | Average Volume | EPS |
|---|---|---|---|---|---|---|
| $63.47 | $65.60 | $63.29 - $92.78 | $130B | 2.04B | 17.6M | $1.69 |
Uber Financials Summary
As of 30-Sep-2026, Uber has a trailing 12-month revenue of $56.5B.
|
In Thousands, USD |
TTM 30-Sep-2026 | FY 2025 31-Dec-2025 | FY 2024 31-Dec-2024 | FY 2023 31-Dec-2023 |
|---|---|---|---|---|
| EV | 150,358,794 | 175,054,520 | 132,372,386 | 133,681,331 |
| Revenue | 56,526,000 | 52,017,000 | 43,978,000 | 37,281,000 |
| EBITDA | 5,495,000 | 6,244,000 | 4,664,000 | 3,293,000 |
| Net Income | 3,465,000 | 10,053,000 | 9,856,000 | 1,887,000 |
| Total Assets | 71,067,000 | 61,802,000 | 51,244,000 | 38,699,000 |
| Total Debt | 17,737,000 | 12,080,000 | 11,126,000 | 11,224,000 |
Uber Valuation & Funding
| Deal Type | Date | Amount | Valuation/ EBITDA |
Post-Val | Status | Debt |
|---|
Uber Cap Table
| Stock | # of Shares Authorized |
Par Value | Dividend Rate (%) | Original Issue Price |
Liquidation | Liquidation Pref. Multiple |
Conversion Price |
% Owned |
|---|
Uber Comparisons
Industry
Financing
Details


Uber Competitors (39)
One of Uber’s 39 competitors is Lyft, a Formerly VC-backed company based in San Francisco, CA.
| Company Name | Financing Status | Location | Employees | Total Raised | Last Financing Date/Type | Last Financing Amount |
|---|---|---|---|---|---|---|
| Lyft | Formerly VC-backed | San Francisco, CA | ||||
| DoorDash | Formerly VC-backed | San Francisco, CA | ||||
| Grab Holdings | Formerly VC-backed | Singapore, Singapore | ||||
| Carzonrent India | Formerly PE-Backed | New Delhi, India | ||||
| Blacklane | Corporate Backed or Acquired | Berlin, Germany |
Uber Related Research & Analysis
Explore institutional-grade private market research from our team of analysts.
-
Verticals



News about Uber
Dive into recent articles by PitchBook offering invaluable insights and context.
-
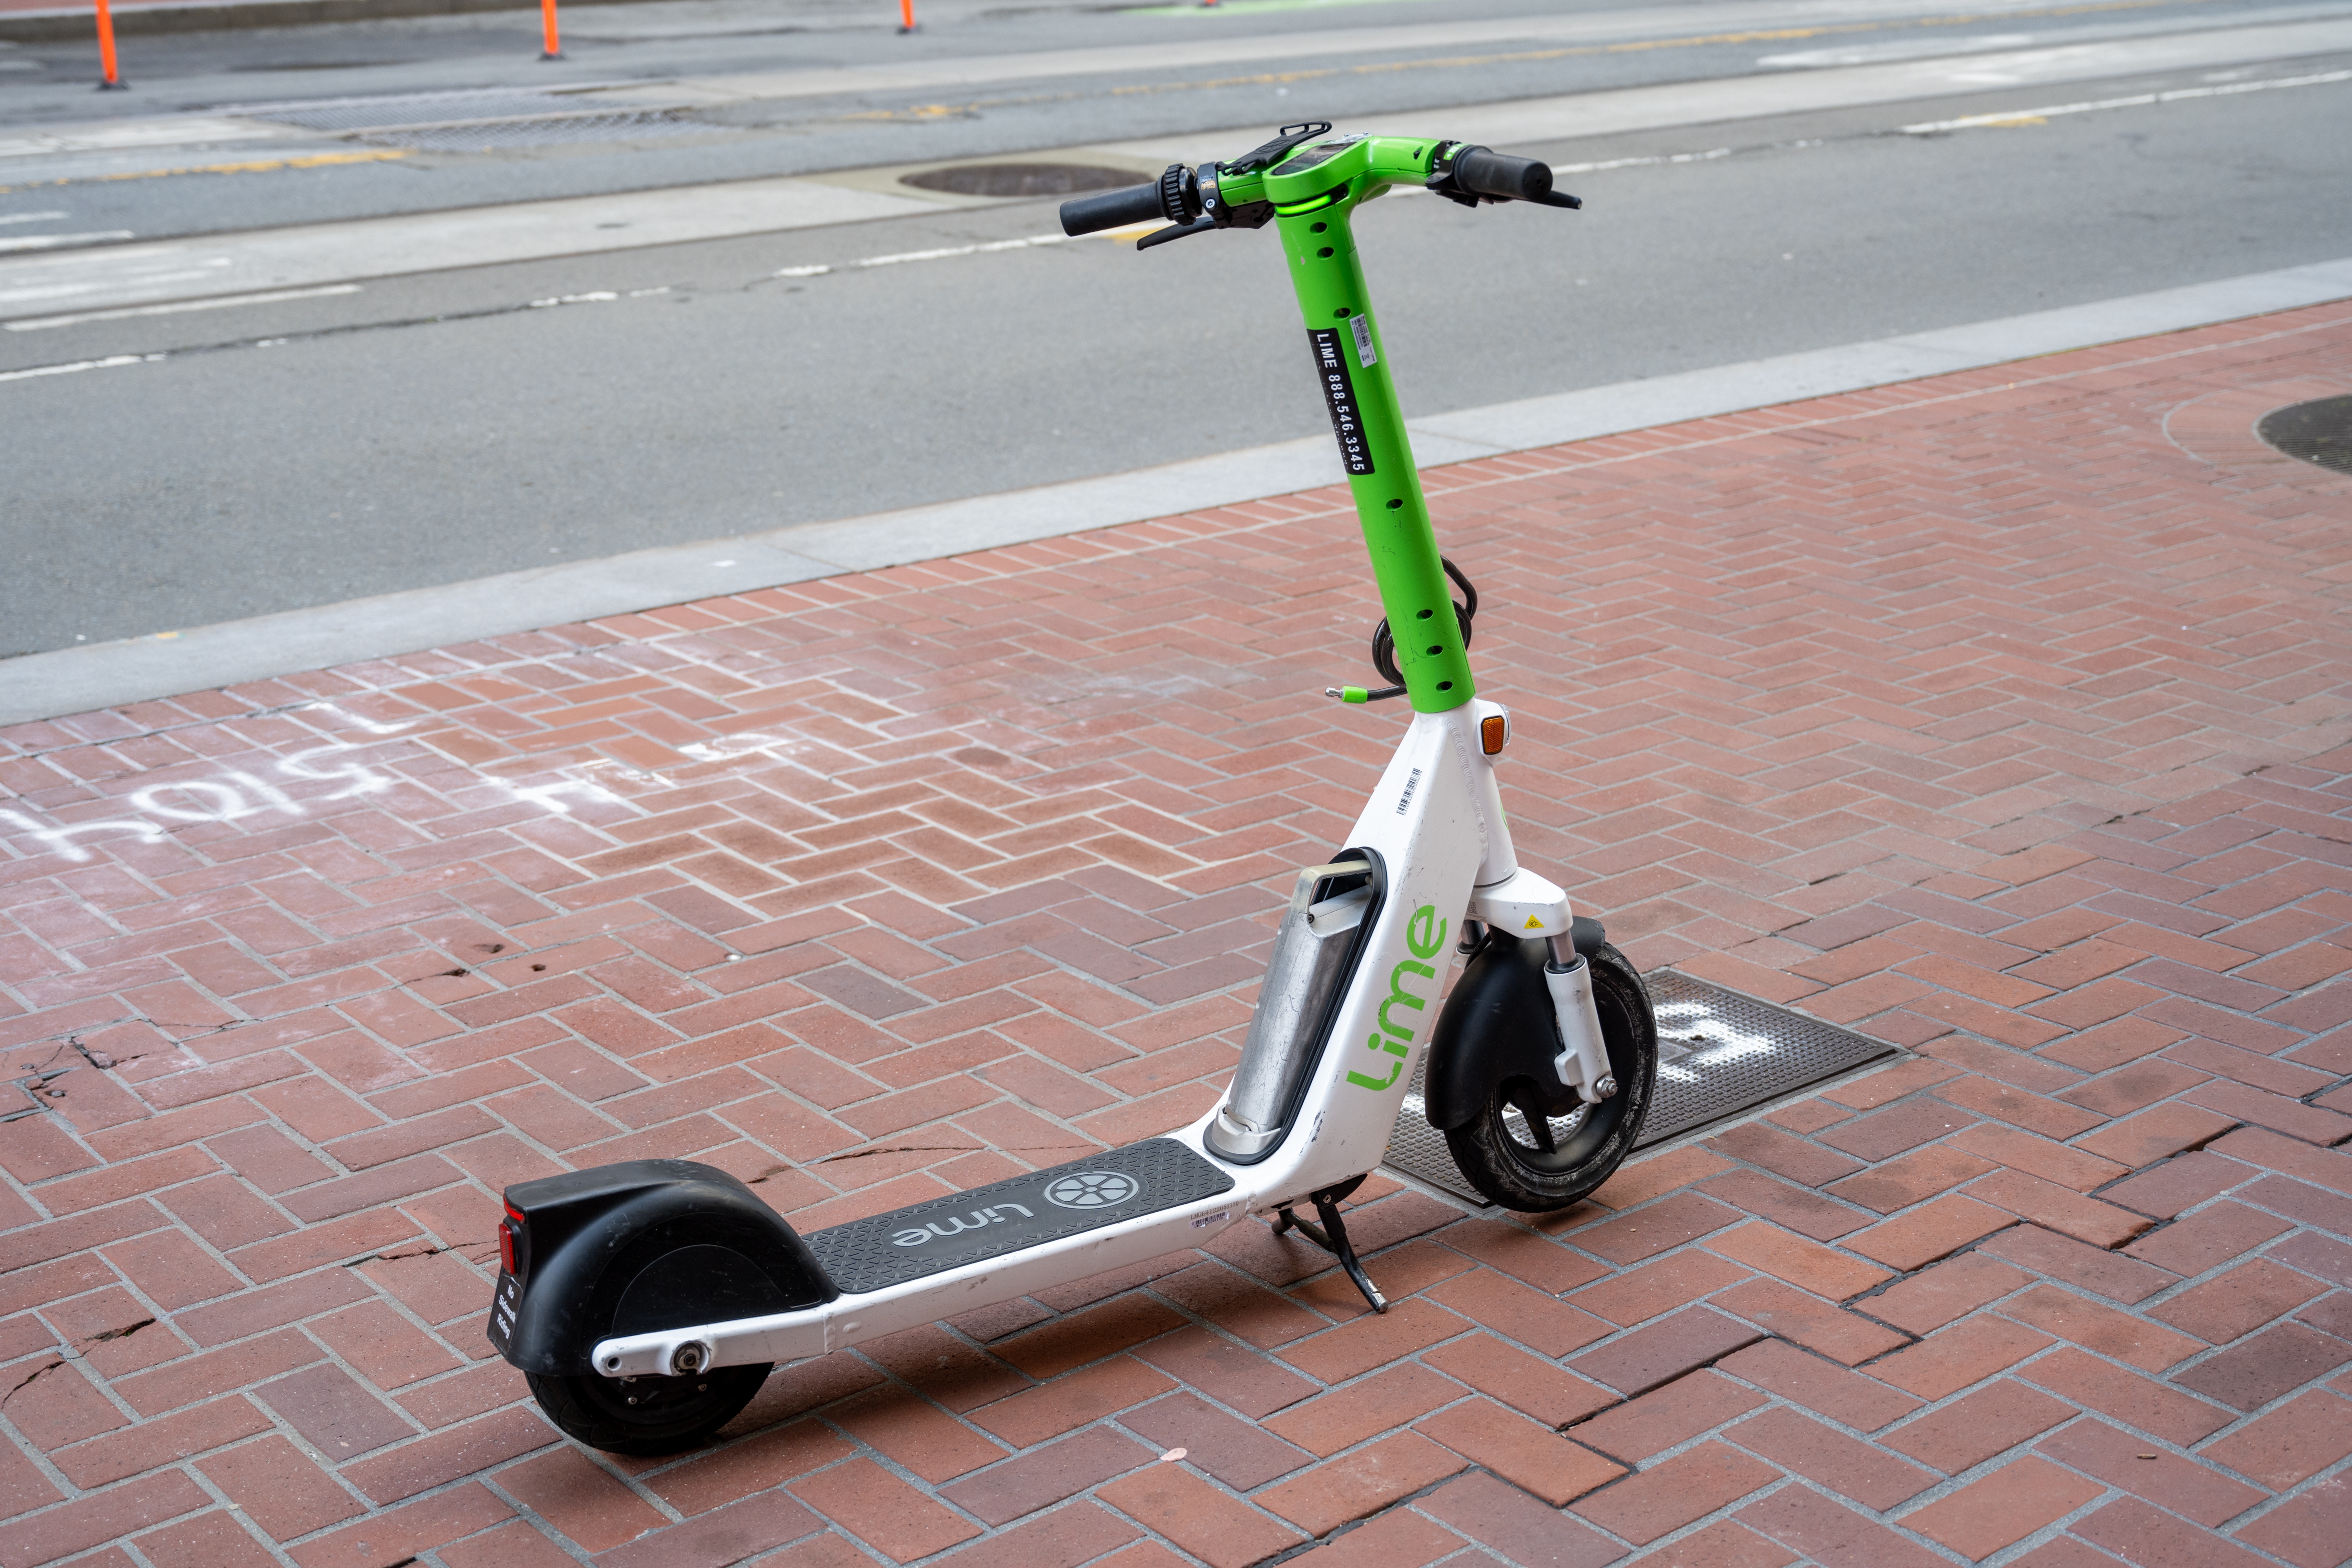
NEWS | Jul 1, 2026
Uber-backed Lime's muted Nasdaq debut caps comeback 'from death'
The company risked defaulting on its heavy debt load without a 2026 IPO.
-
NEWS | Jan 28, 2026
Uber takes another step in returning to the self-driving car race
Autonomous driving startup Waabi raised a $750 million Series C, plus a $250 million commitment from Uber.
-

NEWS | Jul 24, 2026
The hidden cost of PE's AI rush
Rising expenses, overpromised returns, and AI slop could erode the trust firms depend on.
-

NEWS | Jul 10, 2026
Apple sues OpenAI alleging trade secret theft
In an echo from Waymo's lawsuit against Uber a decade ago, Apple is taking the AI race to court.
-

NEWS | May 8, 2026
E-scooter rental company Lime files for IPO as debt maturities loom
The scooter rental industry has struggled for years, despite massive early VC support—Lime is a rare survivor
Uber Patents
Uber Recent Patent Activity
| Publication ID | Patent Title | Status | First Filing Date | Technology (CPC) | Citations |
|---|---|---|---|---|---|
| WO-2026236761-A1 | Destination-specific prompts for transport services | Pending | 09-May-2025 | ||
| US-20260252976-A1 | Contextual confirmation cards | Pending | 24-Feb-2025 | ||
| WO-2026178502-A1 | Contextual confirmation cards | Pending | 24-Feb-2025 | ||
| US-12794999-B2 | Forecasting requests based on context data for a network based service | Active | 27-Jan-2025 | ||
| US-20260187548-A1 | System and method for generating transport chain services | Pending | 31-Dec-2024 | G06Q10/025 |
Uber Signals
Growth Rate

Growth

Size Multiple


Key Data Points
Similarweb Unique Visitors

Majestic Referring Domains

Uber Investors
| Investor Name | Investor Type | Holding | Investor Since | Participating Rounds | Contact Info |
|---|
Uber Investments & Acquisitions (117)
Uber’s most recent deal was a Later Stage VC with Zipline for . The deal was made on 05-Nov-2026.
| Company Name | Deal Date | Deal Type | Deal Size | Industry | Lead Partner |
|---|---|---|---|---|---|
| Zipline | 05-Nov-2026 | Later Stage VC | Logistics | ||
| ezCater | 06-Oct-2026 | Merger/Acquisition | Other Restaurants, Hotels and Leisure | ||
| it's electric | 15-Sep-2026 | Later Stage VC | Other Utilities | ||
| Carrum Mobility Solutions | 09-Sep-2026 | Early Stage VC | Road | ||
| Galgo (Consumer Finance) | 13-Aug-2026 | Later Stage VC | Consumer Finance |
Uber ESG
Risk Overview
Risk Rating
Updated November, 17, 2026
19.07 | Low Risk
Risk Scale
A lower score indicates better sustainability
Negl
0-10
Low
10-20
Med
20-30
High
30-40
Severe
40+
Exposure
Exposure refers to the extent to which a company is exposed to different material ESG issues
Management
Management is related to actions taken to manage ESG issues
Peers Analysis
Peer performance insights compare the company’s ESG performance to the performance of selected peers to help inform future ESG decisions and drive internal performance improvements.
Global
Covered Companies
of 13,592
Rank
Percentile

Software & Services
Industry
of 899
Rank
Percentile

Internet Software and Services
Subindustry
of 177
Rank
Percentile

Uber Exits (27)
Uber’s most recent exit was on 15-Dec-2025 from Momenta Technology. The exit was categorized as with 18 buyers.
| Company Name | Exit Date | Exit Type | Exit Size | Status | Buyers |
|---|---|---|---|---|---|
| Momenta Technology | 15-Dec-2025 | Completed |
|
||
| Serve Robotics | 10-Aug-2023 | Completed |
|
||
| Serve Robotics | 04-May-2023 | Completed |
|
||
| Serve Robotics | 06-Dec-2021 | Completed |
|
||
| Aurora Innovation | 04-Nov-2021 | PIPE | Completed |
|
Uber Affiliates
Subsidiaries (14)
| Name | Industry | Location | Year Founded |
|---|---|---|---|
| Thriving Springs | Lewes, DE | 2022 | |
| Segments.ai | Kessel-Lo, Belgium | 2020 | |
| ReRyde | Burnaby, Canada | 2018 | |
| Getir | Istanbul, Turkey | 2015 | |
| HKTaxi | Hong Kong, Hong Kong | 2014 |
Uber FAQs
-
When was Uber founded?
Uber was founded in 2009.
-
Where is Uber headquartered?
Uber is headquartered in San Francisco, CA.
-
What is the size of Uber?
Uber has 37,300 total employees.
-
What industry is Uber in?
Uber’s primary industry is Automotive.
-
Is Uber a private or public company?
Uber is a Public company.
-
What is Uber’s stock symbol?
The ticker symbol for Uber is UBER.
-
What is the current stock price of Uber?
As of 20-Nov-2026 the stock price of Uber is $63.47.
-
What is the current market cap of Uber?
The current market capitalization of Uber is $130B.
-
What is Uber’s current revenue?
The trailing twelve month revenue for Uber is $56.5B.
-
Who are Uber’s competitors?
Lyft, DoorDash, Grab Holdings, Carzonrent India, and Blacklane are some of the 39 competitors of Uber.
-
What is Uber’s annual earnings per share (EPS)?
Uber’s EPS for 12 months was $1.69.
Data Transparency
-

Meet our data hygiene team
Discover how our experts ensure you’re getting the most accurate financial data in the industry.
Read more -

How PitchBook sources data
Our data operations team has logged over 3.5 million hours researching, organizing, and integrating the information you need most.
Discover our process
