
PitchBook helps you build more accurate comparables with greater transparency and speed. Fueled by our research process, our data coverage and flagship platform provide you with comprehensive insights across the private and public markets—including the world’s largest source of deal multiples and valuations.
After completing a Companies & Deals search, you can use PitchBook’s charts and pivot table tools to dig into how much capital has been invested over time by industry, vertical, and deal type. Simply add and remove fields to build a customized view of the aggregate data from your search results. You can also use the PitchBook Excel plugin to pull the data you need into your own models.
Here’s how it works.
Research capital invested by industry, vertical, and deal type
1. Conduct a Companies & Deals search
Found in the screeners section of the platform’s left-hand navigation bar, the companies and deals search option will set up the following advanced search fields for you to select from.
2. Select deal criteria
Deal date and deal size are common fields used in conjunction with deal type. Refine your list further by pre- and post-money valuation amounts, total capital raised, and deal status. In the example below, we are looking at full transactions completed since January 2017, where the total raised was $5 million or more.
3. Filter by industries and keywords
Select an industry and/or vertical to focus in on a sector and then add keywords to target specific products, services, or themes. To help illustrate, we included a filter for the B2C industry.
4. Search by location
Check the “Search HQ Only” box to target the main office and eliminate satellite branches. By selecting “Any Office Location” you can see the branches of a company that is headquartered in another region. In this case, we’ll focus only on companies with headquarters in Europe.

PitchBook Companies & Deals search criteria screenshot
5. Visualize the data
Select the charts or pivot table tools to build a customized view of the aggregate data from your search results. Whichever option you pick, you can then visualize your data by companies, deals, or investors.
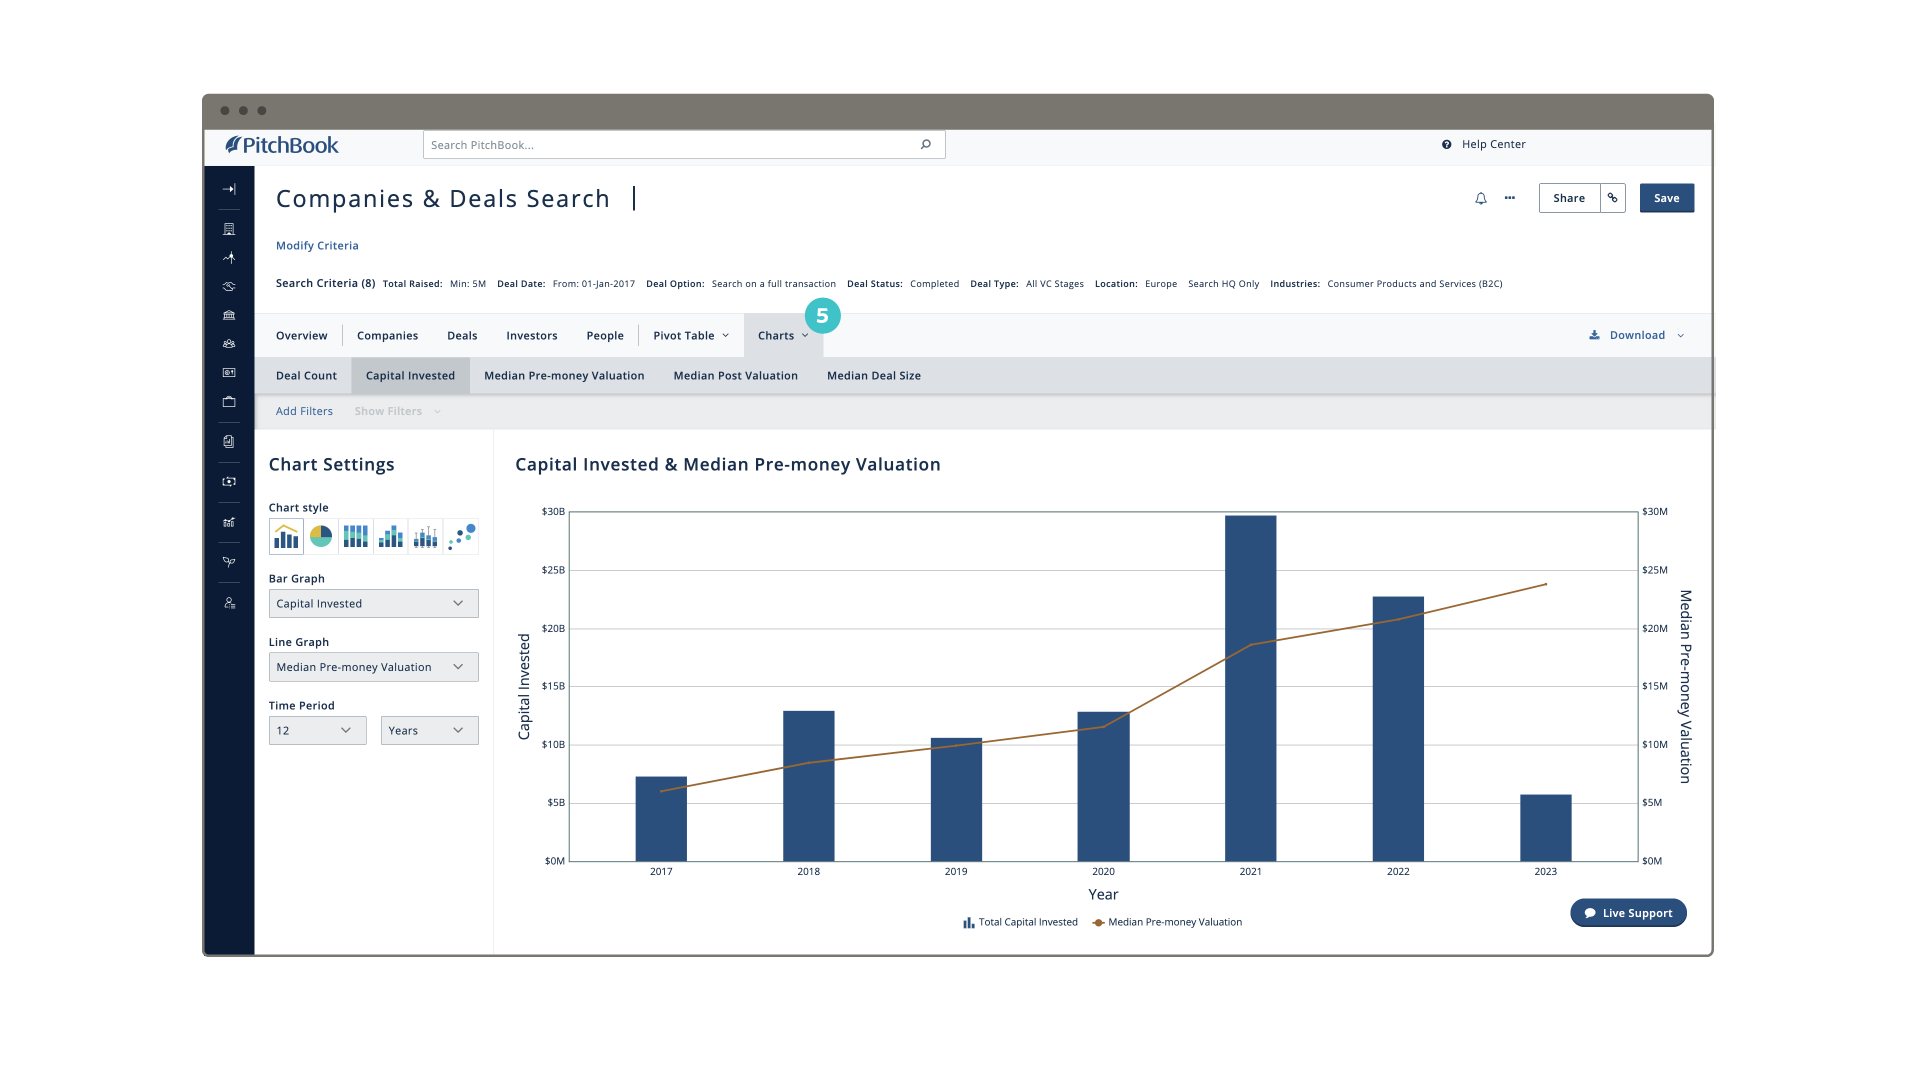
PitchBook Companies & Deals search result featuring chart of capital invested and median pre-money valuation
6. Review capital invested
To see an overview of the total capital invested in a space, choose the capital invested option from the drop-down menu on the left side of your screen.
Calculating deal multiples
1. Find financials and multiples
From the Deals column of your search results, hover over the “Edit table” option, then click the “Edit Columns” setting. Next, locate the financials and multiples section near the middle-right side of the page. This will bring up specific deal multiples for each deal in your search results.
2. Refine your results
Check any of the empty fields that you want to add. Then click and drag each column to rearrange the data.

PitchBook deals search refined by select financials and multiples
3. Consolidate the data
Instead of viewing the individual multiple for each deal, you can use the Pivot Table tab to combine all the deals in your search results into one table and view the consolidated data. Simply click on the blue plus button to add the data you want to review within the table or chart you’ve created.

Pivot table with consolidated PitchBook deal data
Want to learn more about how your firm can close the right deals faster with PitchBook?
Download our Deal execution guide, which provides step-by-step instructions on how you can quickly build more accurate comparables, streamline your valuation workflow, and connect with the right buyers and investors.