
Because private market funds are based on different strategies and structured on entirely separate return profiles compared to public funds, it’s necessary to consider alternative metrics when evaluating their performance. From internal rate of return (IRR) to public market equivalent (PME), it’s important for investors and other private market professionals to be familiar with these concepts.
Here, we look at the differences between IRR and PME, the advantages and disadvantages of both formulas as fund performance metrics, and additional formulas to know.
What do IRR and PME have in common?
Both internal rate of return and public market equivalent are performance metrics used for closed-end funds.
What are closed-end funds?
Closed-end funds are pools of capital with a defined investing period, including private debt funds, private real estate funds, secondaries, infrastructure, and other structures. In this case, investors are typically locked into that investment for a decade or longer. This differs drastically from open-end funds, which allow investors to constantly make allocations or achieve liquidity in real time (e.g., hedge funds).
Why do IRR and PME matter?
An investor who is committed long-term to an investment should consider different performance metrics than an investor who can redeem capital quickly. Especially in relation to IRR and PME, fund structure and cash flows heavily impact which metrics an investor may use. As we’ll see, however, not all metrics are created equal and there is no single calculation to account for all variables.
A closer look: Internal Rate of Return (IRR)
Internal rate of return is one of the main metrics used for benchmarking and gauging fund performance. By the book, IRR is the discount rate that makes the net present value (NPV) of future cash flows equal to zero. Firms often use it to estimate how profitable a potential investment may be. The higher the IRR, the more profitable an investment.
The IRR formula looks like this:
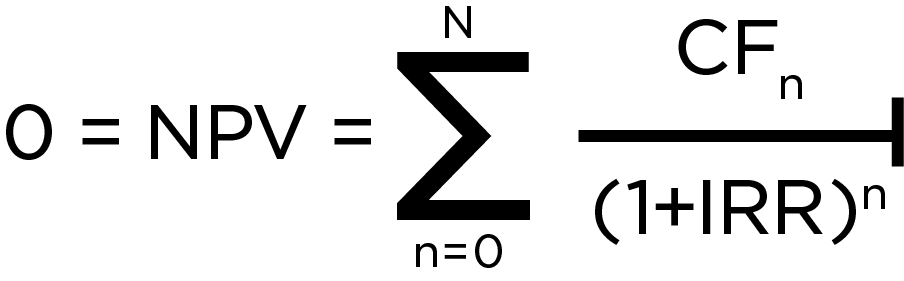
Where:
CF1, Cf2, CF3, .... CFn = Cash flows
N = Holding period
NPV = Net Present Value
IRR = Internal Rate of Return
What does it mean? Essentially, the calculation accounts for the irregularities and nuances of cash flows.
The timing of cash flows is critical for IRR. If a fund is only three years old and a cash flow is moved by 60 days, it is going to have a much bigger impact on the IRR calculation than a fund that is 10 or 12 years old with that same time interval.
As a point of comparison, we can look at annualized return calculations. Annualized return looks at the first cash flow and the final one and assumes all of the cash flows in between have constant intervals and sizes. IRR, however, accounts for cash flow irregularity in terms of timing and size. However, one downfall of the calculation is that it assumes an investor is reinvesting at the same rate of return along the time horizon, which is not always realistic.
Private market funds operate differently than almost any other investment strategy. They have defined investment periods which means a lot of the traditional methods people use (whether for broad equities or mutual funds or a hedge fund) just aren’t as applicable. So, for the last several decades, IRR has been the default metric. Some academics and industry professionals have questioned it and have even developed alternatives, but IRR has proven to be resilient against any sort of criticism. Only in the last five years or so has the criticism started to gain traction, especially from LPs who have been invested for several cycles and have developed a more nuanced understanding of IRR.
A closer look: Public market equivalent (PME)
The public market equivalent was originally developed by Austin Long and Craig Nickels in the late 1990s. At the time, they argued IRR was an insufficient way to be judging private market fund performance and sought out a better way to do it.
PME is a metric we often use at PitchBook to compare private capital fund performance to public indices. Essentially, the metric adapts public market returns into an IRR-like metric that accounts for irregular and fluctuating cash flows. It’s designed to give investors more of an apples-to-apples comparison between private market funds and public benchmarks. It is exclusively used for private market funds and because of that investors may not be as familiar with using it. In addition, PME formulas can take different forms.
Other calculations to know
Long-Nickels PME (LN-PME)
This calculation takes cash flows of a PE fund and redirects them to a hypothetical “PME vehicle” that purchases an equal value of the indexed asset.
Although most people use the S&P 500 as a simple index, the model can be tailored for any index. The downside, though, is that the vehicle is hypothetical. It’s esoteric and trying to explain it simply or in a few sentences is hard to do. Another problem with this PME formula is its use in IRR calculations. Given cash flow timings in PE and complications in calculations, there is about a one in five chance of ending up with no value whatsoever. In the words of Long and Nickels, “If a private investment greatly outperforms the index because it makes frequent, large distributions, it is possible for the final value determined by the index comparison to be negative.”
That leads us to future iterations of this formula which were designed to address this issue: PME+ and Kaplan-Schoar PME:
PME+
PME+ uses the same methodology as the Long-Nickels PME, but distributions are scaled by a constant to avoid negative NPV situations. Simply put, it adjusts the cash flows to ensure there aren’t big discrepancies. The downside, however, is that it moves the cash flows. As a result, the cash flows of the PME vehicle are not a perfect match to the cash flows of the PE fund, so investors lose that direct comparison. Similar to in the LN-PME methodology, the output of PME+ is still an IRR calculation.
Kaplan-Schoar PME (KS-PME)
Unlike the two previous methods, the Kaplan-Schoar PME (KS-PME) provides a market-adjusted cash multiple. The results of the calculation are straightforward; if the end value is higher than one, then the private market fund has outperformed the respective public market index and if it’s lower than one, it has underperformed. KS-PME also benefits from the same flexibility as other PME calculations. If the index needs to change, that can be adjusted. An investor can also combine cash flows from an entire portfolio.
We like to use this method here at PitchBook—and it’s not just because the methodology’s co-creator sits on the board of Morningstar (we promise).
See IRR and PME in practice
Download the latest PitchBook Benchmarks reportOur quarterly report series provides visibility into both fund performance and the underlying metrics used to construct each benchmark.
Read more about private market benchmarks and how they're usedCheck out our blog post that explores private market benchmarks and why they matter.
See how benchmark data can help investors navigate volatile markets
Check out our blog post on tools such as the PitchBook benchmark feature that can prepare investors for volatile markets.
Discover how your firm can leverage PitchBook to benchmark fundsOur customers dive deep into accurate, comprehensive fund data to see what's driving returns, customize peer groups and construct precise benchmarks—check out how.
See an example of KS-PMEWatch our Fund Performance Explained webinar at 16:30 to see a calculation walk-through.
More on PitchBook’s data coverage
See how our data can take your firm further Explore PitchBook’s robust private market data coverage, including actionable insights on funds, investors, companies, deals, and more.