
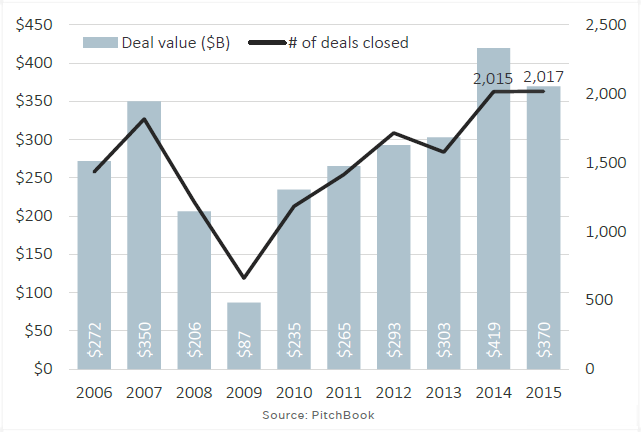
Activity in the U.S. PE middle market remained at an elevated level in 2015, though total deal value decreased by 12%.
Part of this decline can be attributed to a record 2014, as covered in our latest U.S. PE Middle Market Report, but we also think we are beginning to see a normalization around multiples. Click here to download the full report, which offers in-depth analysis on the factors driving activity, but if you’re looking for a quick visual summary on the state of the U.S. PE middle market, look over the charts below:
1. U.S. PE middle-market activity by year
Another banner year for activity, but a sizable decrease in deal value
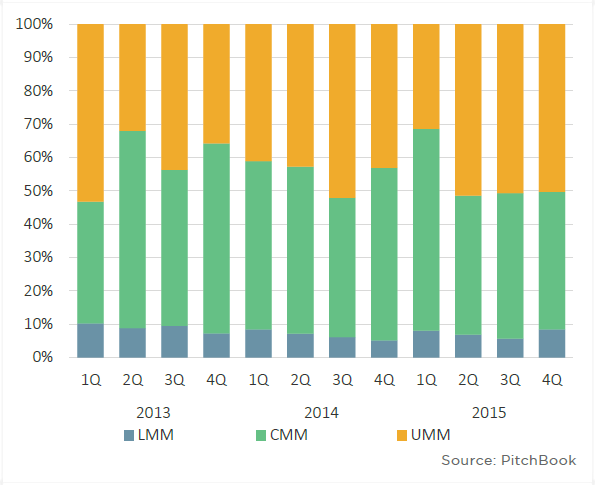
2. U.S. PE middle-market deal value ($) by segment and quarter
The value of core-middle-market deal flow shrunk considerably after 1Q 2015
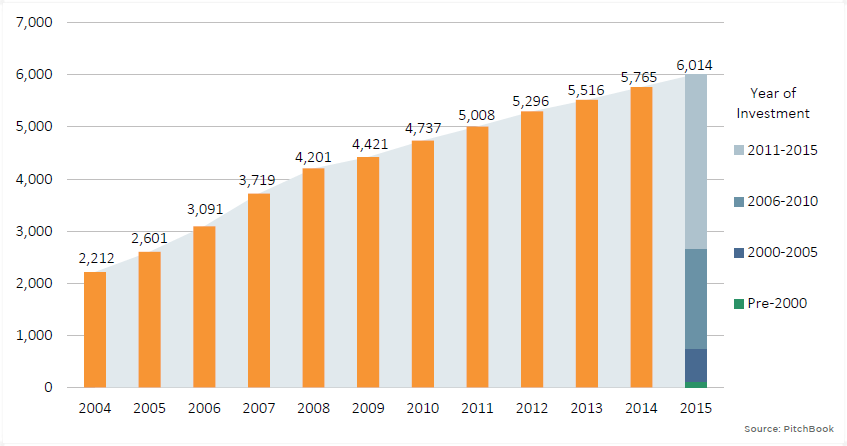
3. U.S. PE middle-market company inventory by count and year
44% of the current inventory was acquired in 2010 or earlier
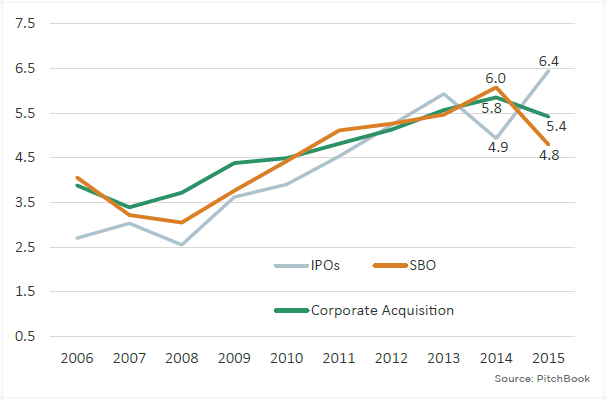
4. U.S. PE middle-market median hold period by exit type and year
As strategics have remained hungry, GPs have been able to offload market-ready portfolio cos. at a slightly faster clip
5. U.S. PE-backed middle-market exits by year
A rush in 4Q left the year on a high note for sellers
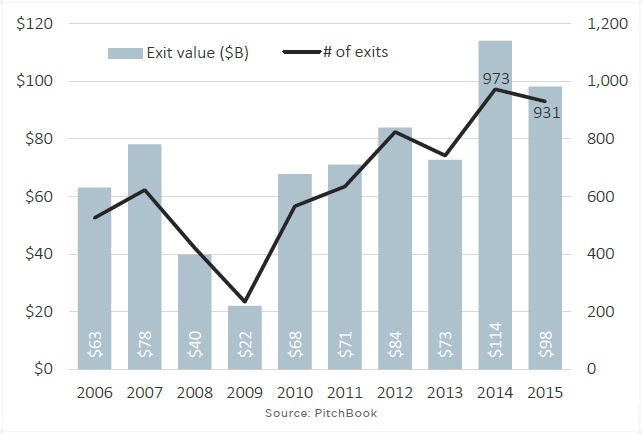
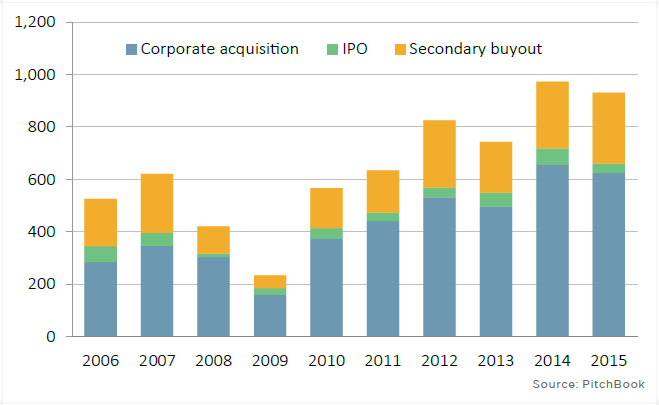
6. U.S. PE-backed middle-market exit count by type and year
Corporate acquisitions continue to play a key role
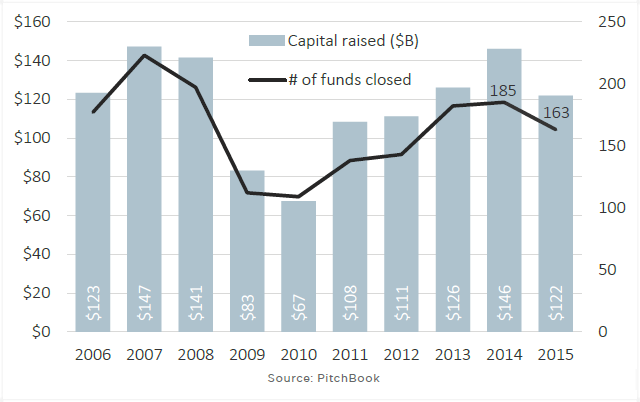
7. U.S. PE middle-market fundraising by year
On the whole, 2015 marked another strong year for fundraising
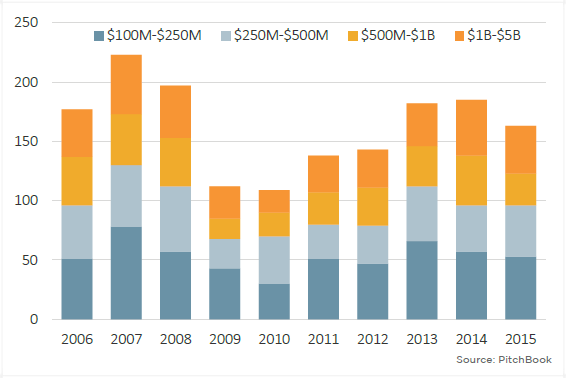
8. U.S. PE middle-market fund count by size
Mega-type funds have declined in both count and size
Learn about our editorial standards.