

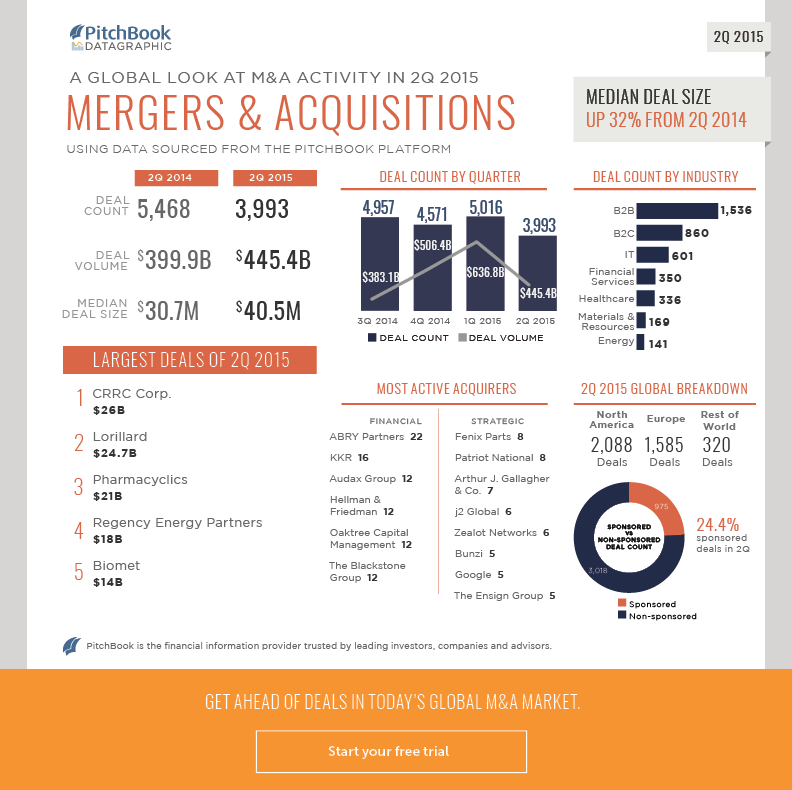
Global M&A activity in 1H blew past a whopping $1 trillion in deal volume, with 2Q recording noticeable YoY jumps in total value and median deal size amid a drop in completed transactions. We’ve put together a datagraphic for a visual representation of the quarter, including breakdowns by industry and region, along with rankings of 2Q’s largest deals and most active acquirers:
Learn about our editorial standards.