

US PE deal activity in 2017 wasn’t far off the high of 2016, as dealmakers put $538.2 billion to work across 4,053 transactions. The relatively flat activity YoY may seem surprising, as dry powder reserves have been steadily growing amid the record-breaking fundraising environment of the past few years, but the excess of capital is complicating dealmaking.
Our 2017 Annual US PE Breakdown dives into the data on transaction multiples, secondary buyouts, funds and more to analyze what factors will affect 2018’s PE landscape and how. The full report is available to download for free, but for a quick look at the major trends, we’ve highlighted 12 key charts.
2017 PE activity concluded on par with 2016

Activity slowly cycled down throughout 2017, culminating in a quieter 4Q

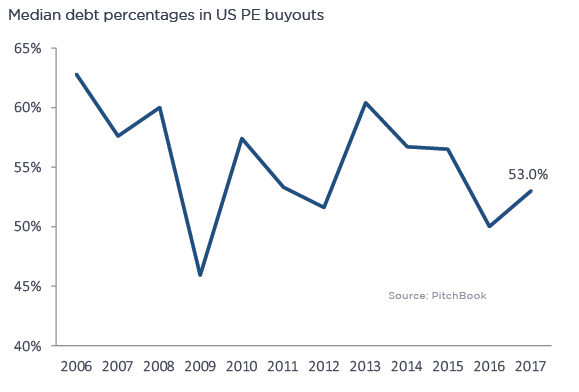
Debt percentages climbed, but they remain within historical bounds
Multiples persist at elevated levels

Deal size trends hold steady

Funds are raising not only more capital, but also closing faster

Exits decline below long-term trends

A new all-time high in PE-backed exits

Capital accrued increases 8% YoY, even as volume drops

Mega-funds primarily drive aggregate commitments

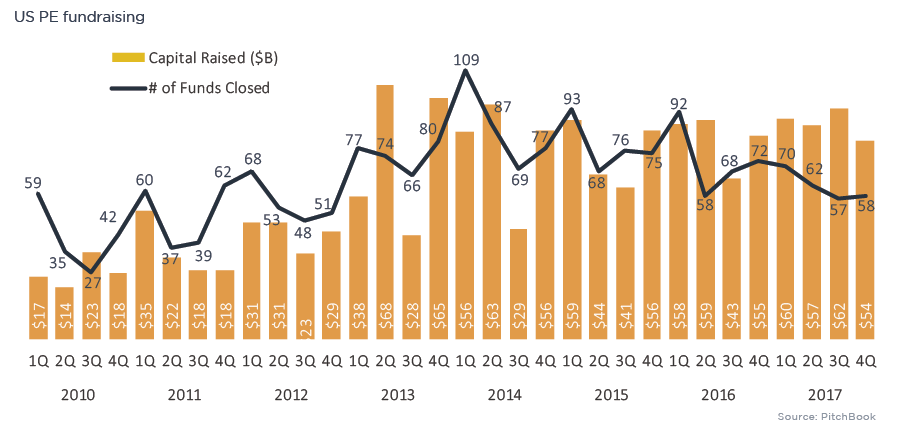
PE funds closed the lowest number of funds in a 6-month period since 2012
Capital flows are becoming increasingly concentrated

Looking for more detailed analysis? Check out the full PitchBook 2017 Annual US PE Breakdown.
Learn about our editorial standards.
