

Distressed exchanges as a share of leveraged loan defaults have risen sharply since the 2020 downturn, gaining in popularity among troubled companies and their lenders seeking to avoid more costly bankruptcy proceedings. However, LCD’s newly unveiled dual-track default rate (DTDR) shows that instances of these companies returning with conventional defaults are rising.
In tandem with LCD’s legacy criteria capturing general defaults of missed payments and bankruptcy filings, LCD is now tracking a separate rate that includes distressed transactions stemming from out-of-court restructurings, exchanges, and sub-par buybacks.
As of Dec. 31, 2023, the trailing 12-month default rates of the Morningstar LSTA US Leveraged Loan Index are as follows:
- Payment default rate (PDR) by issuer count: 2.05%
- Payment default rate (PDR) by amount: 1.53%
- Dual-track default rate (DTDR) by issuer count: 3.84%
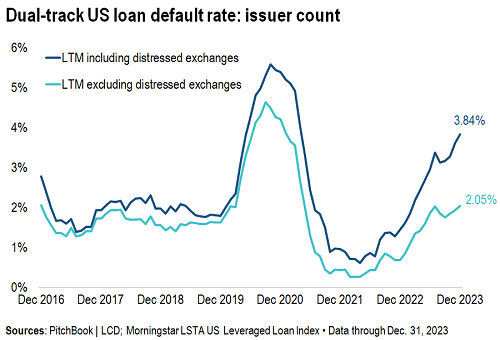
LCD’s data tracking default rates of the US leveraged loan market spans 25 years. The first trailing 12-month legacy default rate of 1.66% by amount, and 1.81% by issuer count, was recorded in October 1998, and since that time, the rates have averaged 2.67%, and 2.47%, respectively.
The current payment default rate (excluding distressed exchanges) by issuer count was 2.05% at the end of December, up 137 bps in 2023 (from a low base of 0.68% at the end of 2022). The dual-track default rate (which includes payment defaults and distressed exchanges) was 3.84% by issuer count at the end of 2023, up from 1.45% at the end of 2022. Default rates are measured as the trailing 12-month calculation of defaults among performing companies in the Morningstar LSTA US Leveraged Loan Index.
The differential between the legacy default rate, and the dual-track rate, is at its widest point since the start of our dual-track data in 2016. During the pandemic default cycle of 2020, the issuer default rate when including distressed exchanges peaked at 5.58%, versus 4.64% when excluding distressed exchanges. At 3.84%, the dual-track rate including distressed exchanges is moving significantly closer to the pandemic peak than the legacy rate of payment defaults.
To access LCD’s dataset featuring default rates, distress ratios, downgrade ratios and LCD’s methodologies, click here.
Distressed exchanges
Mirroring the increase in general payment misses and bankruptcy filings among leveraged loan issuers, defaults and selective defaults stemming from distressed exchanges have risen rapidly from post-pandemic lows.
LCD’s data show the number of loan issuers conducting distressed exchanges in 2023 grew 133%, to 21. From a relatively low watermark, traditional payment defaults jumped by 200%, to 24 issuers during the same period.
More pertinently, distressed exchanges as a share of default activity have skyrocketed.
In 2019, for example, leveraged companies conducting distressed exchanges targeting index loans represented just 10% of default activity, versus 90% for payment and bankruptcy defaults.
In 2020, this rose to 22%.
Since then, distressed exchanges are making up an even larger slice of the default landscape. During the relatively low default period of 2021, these transactions as a share of defaults jumped to 55%. However, even as default activity resumed at speed with rising interest rates, the share of distressed exchanges remained elevated, at 53% of defaults in 2022, and 47% in 2023.


Sponsored defaults
Breaking the data down shows a stark difference in the restructuring activity of sponsored versus non-sponsored entities.
In 2023, sponsored companies drove 90% of distressed exchanges. In 2020, another active year for restructurings, sponsored companies drove 80% of distressed exchange defaults.

One reason for the elevated rates of exchanges for sponsored companies is that distressed exchanges are more likely to preserve the equity stake held by private equity firms, which can be a particular pain point as defaults among portfolio companies start to rise.
For payment defaults, this picture was evenly split in 2023 and 2020, with sponsored and non-sponsored each making up 50% of conventional defaults.

Staying with payment defaults, the legacy loan payment default rate (PDR) for sponsored companies in December was 1.60% by issuer count, versus 2.73% for non-sponsored. This is measured as the trailing 12-month calculation of defaults among performing sponsored, or non-sponsored companies in the Morningstar LSTA US Leveraged Loan Index.
As in 2020, this differential widened with the increase in default activity in 2023. At the end of 2022, the default rate by issuer count for sponsored companies was 0.67%, versus 0.68% for non-sponsored.

Looking at default risk and term to maturity, in the span of LCD’s dual-track dataset, loans targeted with a liability management transaction outside of payment defaults had an average of 33 months left to maturity.
Focusing on the more active years for debt restructurings, during the pandemic-driven default wave of 2020, leveraged loans defaulting via a distressed transaction had an average of 34.6 months left to maturity.
In 2022 and 2023, with heightened default activity among floating-rate loans amid rising base rates, the average time left to maturity was 32.8 and 30.2 months, respectively.
Finally, in 2016 — a year dominated by defaults from the oil & gas industry following a collapse in energy prices and rising distress levels — the average time to maturity was 42 months, with borrowers capitalizing on buying back debt at a steep discount to par.

Why the rise in exchanges?
In addition to preserving ownership and control for issuers, and of course the cost and time borne by the company to restructure, the appeal of distressed exchanges is also evident on the other side of the restructuring table.
For investors, recovery rates are proven to be higher via distressed exchanges than via bankruptcy filings, as the time in restructuring is significantly shorter, and asset preservation higher. As demonstrated in LCD’s July 2023 recovery study, “LossStats: Recovery rates improve with dominance of distressed exchange,” the average discounted recovery for distressed exchanges is 79%, 19 points higher than the average of 60% for bankruptcies lasting less than 6 months, and 26 points higher than the average of 53% for those lasting less than one year.
For bankruptcies lasting 1-3 years, the average discounted recovery drops to 47%. The pattern is the same for term loans — recoveries are considerably higher following a distressed exchange than following a prolonged bankruptcy process.

Can-kicking
Despite the increasing popularity of distressed exchanges, LCD’s data shows that of the issuers conducting these liability management exercises during the pandemic default wave of 2020, nearly a quarter returned with a conventional default of missed interest payments or a bankruptcy filing within the next three years.
More recently, troubled companies conducting distressed exchanges are still confronting higher interest rate burdens on their floating-rate debt, and more expensive credit conditions in refinancing or extending obligations.
In 2022, despite the shorter timeline, the share of companies returning with a payment default or bankruptcy jumped to 33%.

Of course, in some instances, a distressed exchange is merely a can-kicking exercise if the debt reduction is not far-reaching enough, if industry downturns (as seen in sector-specific cases such as energy and retail) persist, or if operational issues are not addressed.
Of the most famed recent examples of repeat offenders, KKR-backed Envision Healthcare's restructuring escapades epitomized the evolving landscape (and pitfalls) of balance sheet maneuvers for leveraged loan investors, with the company utilizing two primary tactics to facilitate aggressive out-of-court restructurings in 2022, before its eventual bankruptcy filing in May 2023.
As detailed by S&P Global Ratings in a September 2022 report, the company in April 2022 used collateral transfers to remove assets from its collateral package as a means to raise new debt backed by these newly unencumbered assets. To wit, it repurchased approximately $1.5 billion of its existing first-lien term loan B at a blended price of 66% of par.
Within the space of 14 weeks, Envision also enacted a priming uptiering loan exchange, with a share of existing lenders agreeing to amend the existing credit agreement to allow new super-priority priming debt to elevate claims in the event of a default. The transaction, closed on July 22, 2022, entailed a new money $300 million first-out term loan tranche and the conversion of the existing term loans into three different tranches with secured, junior repayment priorities.
In the end, the provider of outsourced physician services would ultimately contribute nearly 18% of defaulted loan volume making up LCD’s legacy rate in 2023.
Breaking down the sectors, companies tied to the healthcare sector were responsible for nearly a quarter of distressed exchanges targeting index loans, with companies from the Health Care Equipment & Supplies, Health Care Providers & Services, and Health Care Technology together making up 24% of distressed exchanges. IT Services follows, at 14%.

With the volume of index loans held by sponsored companies increasing by nearly 20% since the 2020 default cycle, the use of distressed debt exchanges in restructuring workouts is expected to intensify as higher interest rates and borrowing costs continue to bite.
Where will these exchanges come from?
Drilling down the index, the forward indictor of the leveraged loan distressed ratio suggests the risk of default activity — conventional or via distressed exchanges — has eased from the recent peak of December 2022, though pockets of stress point to potential activity in sectors such as healthcare and software.
The distress ratio — defined as the share of performing loans priced below 80 — eased to 4.54% at December's close, representing $62.79 billion of distressed loans. This was down from 5.34%, or $73.95 billion, at the end of November, and a post-pandemic high of 7.36%, or $103.43 billion of distressed loans, in December 2022.

By sector, software represents 25% of index loans below the “distressed” threshold of 80 cents on the dollar. Note that the sector makes up nearly 12% of all outstanding index loans.
Healthcare providers & services follows with 17% of distressed loans.
Going forward, LCD’s monthly default report will feature the legacy payment default rate and the dual-track default rate.
For more information or questions on this dataset, please contact LCD Support at [email protected].
LCD’s criteria explained

Featured image: fhm/Getty Images
Learn about our editorial standards.
