
Want to see the highlights from our 3Q US PE Breakdown? Check out the charts below for insight into the latest trends in PE dealmaking, exits, fundraising and more:
US PE activity
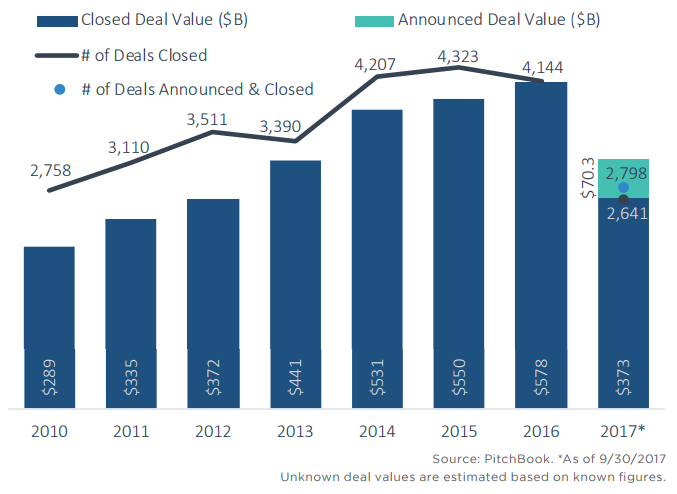
Deal volume through the first three quarters of 2017 is down 11% compared to the first three quarters of last year. Several factors may be fueling the reluctance to complete deals, with some of the biggest centering on price and quality.
US M&A multiples (including PE buyouts)
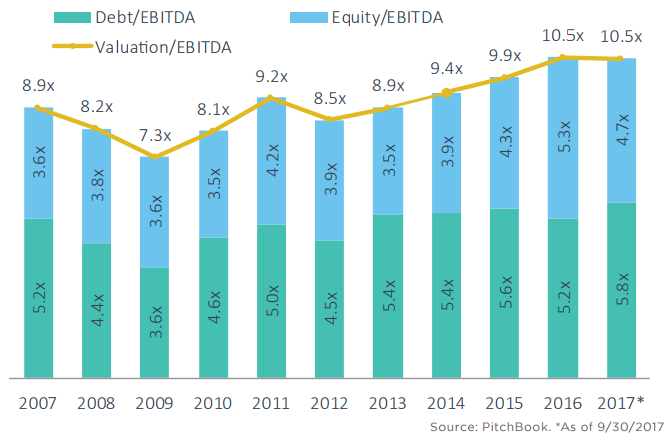
The pullback in PE dealmaking and strategic acquisitions has done little to ease pricing pressures, with the median EV/EBITDA multiple remaining at 10.5x for 2016 and 2017.
$2.5B+ PE deal activity
While the industry in 2017 has been devoid of the type of $10 billion deals we’ve seen in past years—the largest US PE deal to close this year has been the $7.16 billion buyout of Panera Bread by JAB and BDT Capital Partners—the rate of somewhat smaller mega-deals has remained high.

Add-on % of US buyout activity
Add-ons continue to be a key strategy in this high-priced environment, comprising 64% of all US-based buyouts in 2017 to date.

US PE activity in software
Part of the increasing appeal of software is driven by the widespread industry transition to the SaaS business model, which tends to foster recurring revenue streams and steady cash flows—highly attractive features for PE.

US PE-backed exit activity
Despite a much slower exit market than in recent years, activity is still on par with the 10-year average. One factor in the decline is that PE sponsors are struggling to find strategic acquirers for portfolio companies.

US PE-backed exits (#) by type
Corporate acquisitions have only accounted for 46% of exits this year, compared to 50% for secondary buyouts—the lowest and highest percentages recorded in our dataset, respectively.

US PE-backed IPO activity
It’s becoming increasingly difficult to make the case for spending the time and money needed to go through the IPO process when an equal or greater amount can be earned through a private transaction.

US PE-backed company inventory by age
With 38% of US PE company inventory acquired over five years ago, many portfolio companies are either on the market or likely will be soon.

US PE fundraising
Capital commitments keep pouring in as PE firms continue to raise ever-larger sums across fewer funds. US-based funds raised $62.4 billion in 3Q 2017—the most of any quarter since 2Q 2014.

Time to close US PE funds (months)
Even while private equity vehicles have grown in size, the fundraising process in 2017 thus far has gone much quicker than usual.

US PE fundraising ($) by size
Apollo Global Management has led the way this year by closing the firm’s ninth flagship buyout fund on $24.7 billion, surpassing Blackstone’s $21.7 billion 2007 vehicle to become the largest buyout fund ever raised.

Median US PE fund size ($M)
Since 2015, fund sizes have skyrocketed: Through 3Q, the 2017 median for all PE strategies sat at $265 million, higher than any year since 2006.

To download the full report: click here
Learn about our editorial standards.
