
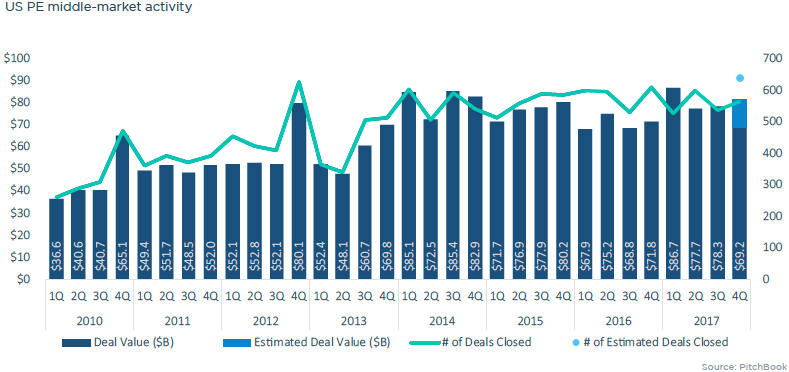
PE firms invested in 2,306 middle market deals in 2017, totaling $324.1 billion. Overall, deal flow remains flat, exits are declining, and fundraising continues to rise—all trends that mirror private equity as a whole, which is unsurprising given that most PE activity takes place in the middle market.
Our 2017 Annual US PE Middle Market Report takes a deep dive into the data on funds, secondary buyouts, add-ons and more, including insight on factors likely to affect the middle market in the coming months. The full report is available to download for free, but for a quick look at the highlights, check out these 12 key charts.
US PE middle-market activity remains robust

MM activity finished the year on a strong note
Purchase-price multiples remain elevated

Deal sizes continue to grow

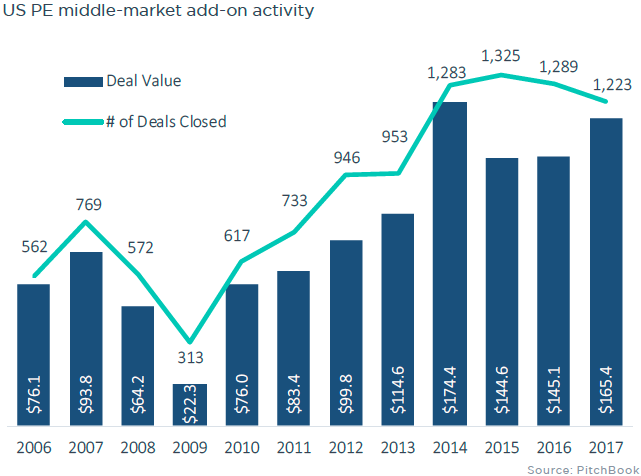
Add-ons remain popular throughout the middle market
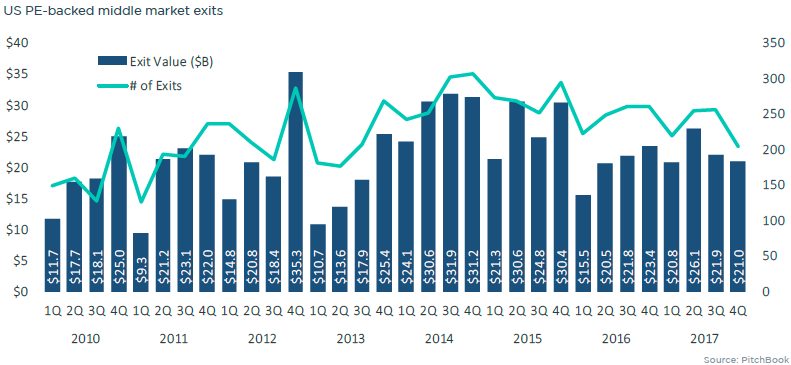
Exits continue to decline YoY

MM accounts for half of PE capital exited

4Q exit count fell to a four-year low
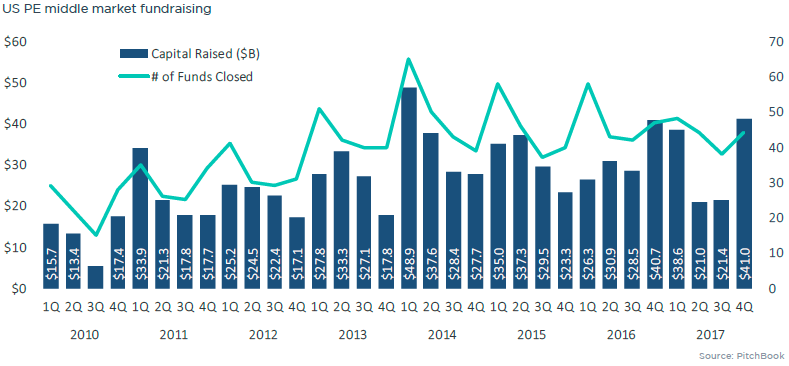
Fundraising totals decline despite uptick in fund sizes

Small funds continue to fall from favor

4Q ends year on a strong quarter, with $41B raised by middle market funds
Capital flows remain concentrated in large vehicles

Looking for more detailed analysis? Check out the full PitchBook 2017 Annual US PE Middle Market Report.
Learn about our editorial standards.
