
Powered by the PitchBook Platform, our 2H 2015 VC Liquidity Report offers data-driven analysis of U.S. VC exit activity in the first half of 2015, as well as over the past decade. The report is broken down by several metrics, including exits by type, sector and valuation, as well as overall exit activity by quarter and year. We’ve extracted the top highlights from the report into the short video above, which presents some interesting findings:
- 1H 2015 has seen 427 exits valued at a combined $27 billion, a bit off pace from 2014’s monster totals but impressive nonetheless.
- Transactions valued within the $100 million - $500 million range, as well as sub-$25 million deals, continue to account for the bulk share of VC exits.
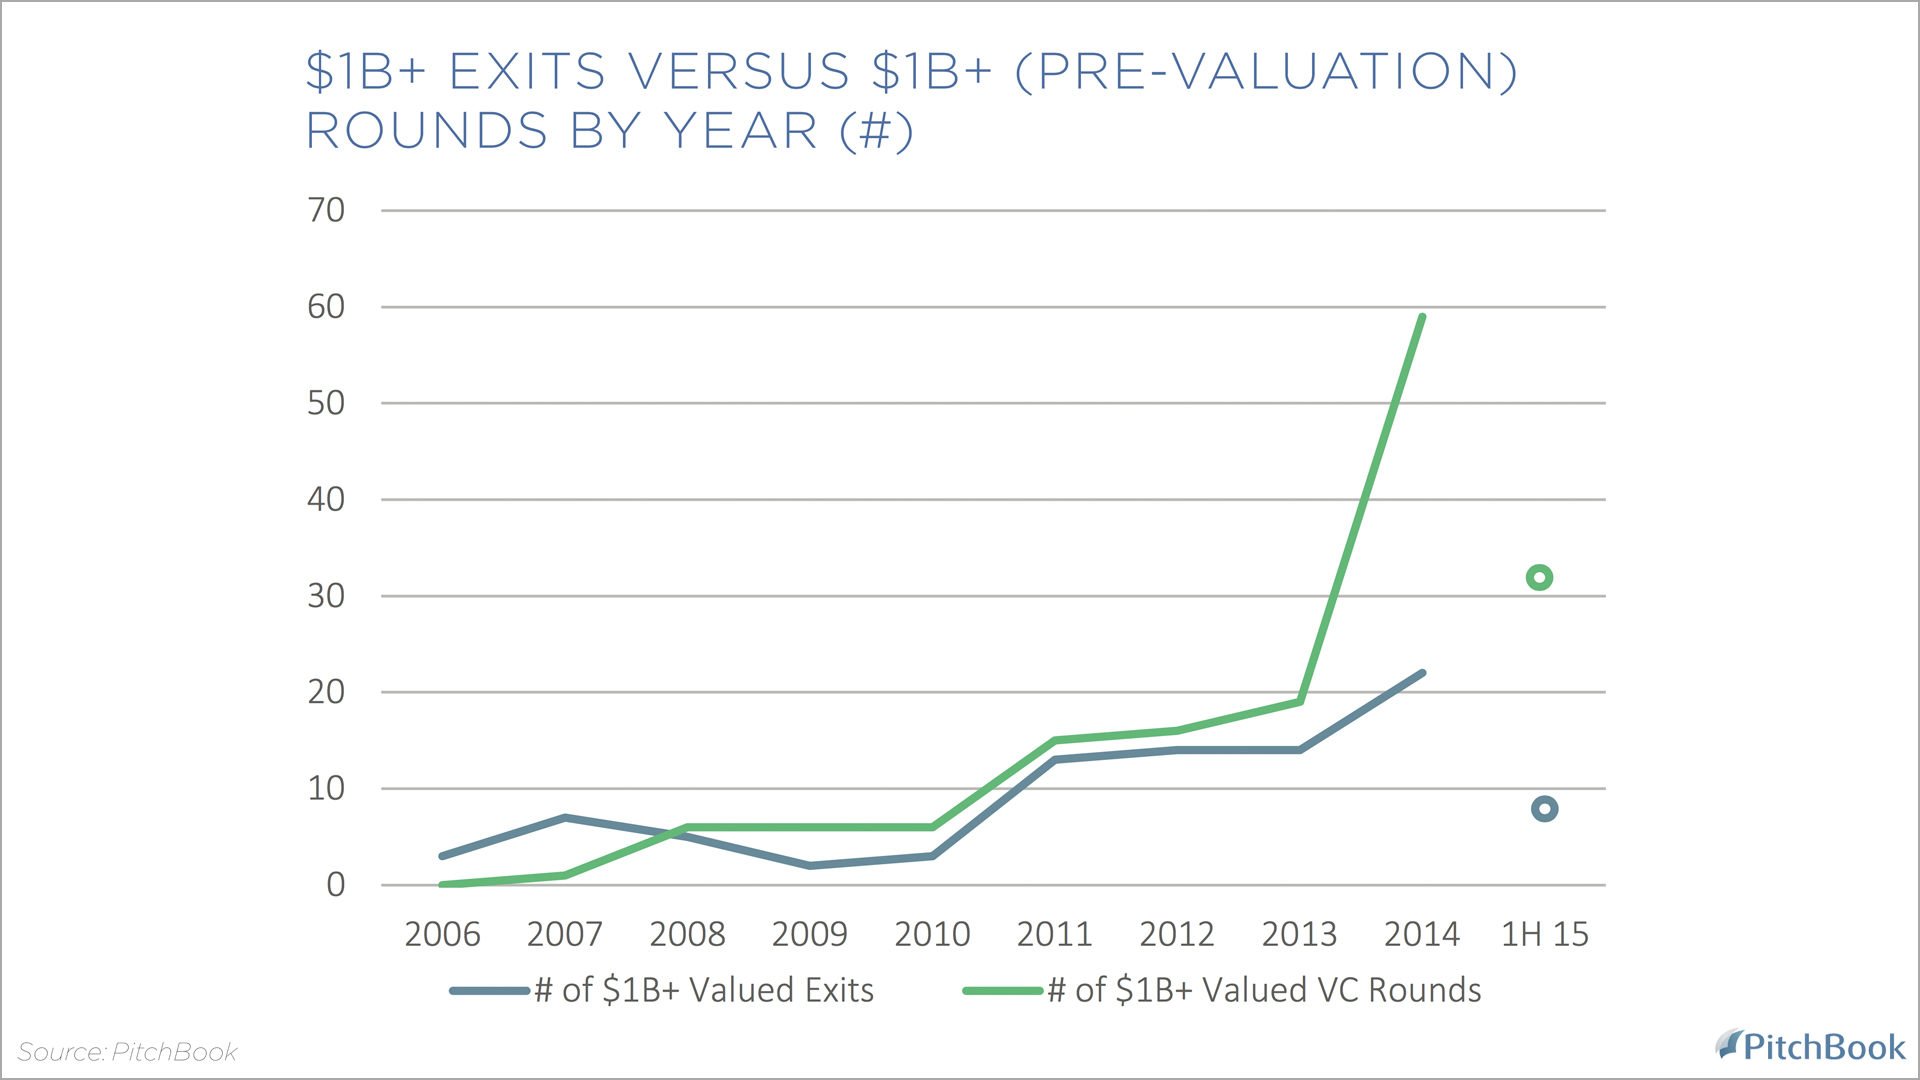
- $1 billion+ rounds are now much more common than $1 billion+ exits by a 4:1 margin; in comparison, last year saw 59 rounds of that value and 22 such exits.
- From first VC round to IPO, it’s taking startups much longer to go public—from around four-and-a-half years in 2006 to now more than eight years. From last VC round to IPO, however, it’s taking less time. Startups that went public in 2015 got financed only six months earlier, roughly a year shorter than what we have seen in the past.
- About 90% of 1H exits were acquisitions—a total of 385 exits valued at over $23 billion.
To download the full 2H 2015 VC Liquidity Report for free, click here.
Learn about our editorial standards.