

Private equity in the US had a blockbuster year in 2018. A booming dealmaking environment propelled the industry to its highest deal count and second-highest deal value on record. As data from last year keeps rolling in, it’s possible that 2018 may be the best year ever in US PE when it comes to these two stats, according to PitchBook analysts. However, it’s been a different story for fundraising and exits, both of which slowed in 2018.
Our 2018 Annual US PE Breakdown dives into these and other major trends of the past year, including a thorough exploration of the data involved. The full report is available to download for free, but for a quick look at the highlights, check out this set of charts.
Deal activity surpasses $700B for the second-highest annual figure ever
Last year marked the first time the US PE industry had closed more than 4,800 deals in a single year, and the deal value came close to the pre-financial crisis high water mark set in 2007. Several mega-deals closed in 4Q, including the $17 billion buyout of the newly renamed Refinitiv (formerly Thomson Reuters’ financial & risk business). The largest deal to close in 2018 overall remains JAB Holding‘s $21 billion buyout of Dr Pepper Snapple Group, which it merged with Keurig Green Mountain.

More deals are priced above 10x than ever before
The median EV/EBITDA multiple shrank slightly from 2017’s number, but the proportion of deals priced above 10x hit 61.4%—the highest rate on record. This is in contrast to the public markets in the US, where multiples dropped sharply YoY. PE firms looking to spend their abundant reserves of dry powder helped lead to 15 take-private buyouts above $1 billion apiece, and the number of these transactions in the US is expected to spike this year.

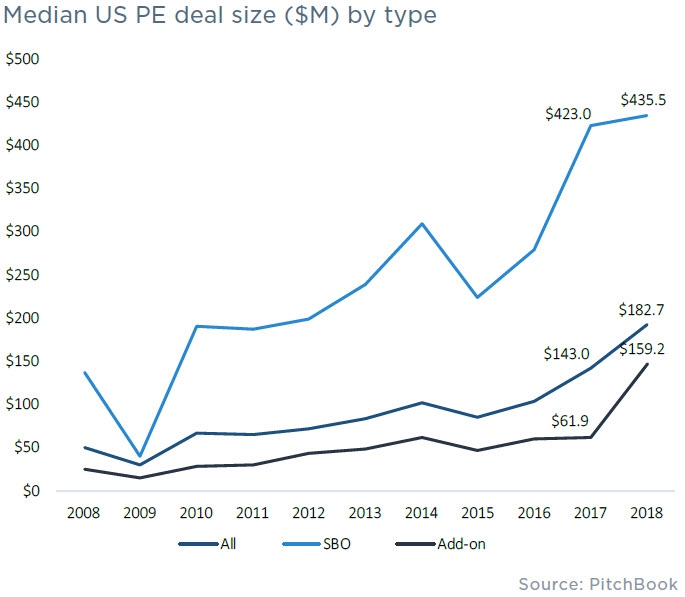
Deal sizes nearly double in 2018 amid fervent competition for add-ons
A surge in add-ons last year was a key factor behind the sizable decline in SBOs, and that frenetic activity also helped drive the median add-on deal size up significantly relative to years past. The median add-on size of $159.2 million was up more than 157% compared with 2017’s median of $61.9 million. In contrast, the median secondary buyout size was nearly flat, increasing about 3% YoY.
GP stakes dealmaking hit a new record in 2018
This report includes a spotlight on GP stakes, which, with its record-setting deal count last year, is one of the more interesting trends in the space at the moment. The surge in GP stakes investing shows no signs of slowing down, as the scope for deal sourcing is expected to widen. The two most active GP stakes investors are Neuberger Berman subsidiary Dyal Capital Partners and the Alternative Investments & Manager Selection (AIMS) group within Goldman Sachs.

Exit value remains relatively flat despite drop in exit count
Last year, PE firms exited some $365.4 billion, a slight increase over the total exit value in 2017, despite a roughly 16% drop in deal count. Meanwhile, the median exit size of $330 million is the largest on record. There were 80 exits above $1 billion, including the $9.5 billion sale of Energy Future Holdings (fka TXU), a marked increase over the 75 recorded in 2017 and the 65 in 2016. The number of billion-dollar exits is expected to continue its surge, thanks to longer hold times and more reliance on the buy-and-build strategy.

PE-backed IPOs make up the lowest proportion of total IPOs in over a decade
PE-backed IPOs neared $50 billion in exit value last year, the highest figure since 2014 and a strong one given the turbulent year on the public equity markets. Many of the biggest exits occurred in the tech sector, though ADT Security Services had the single largest PE-backed IPO of the year when Apollo took it public last January at a $9 billion valuation. Going public has been a successful strategy for the private equity space, but PE-backed IPOs have accounted for a declining proportion of overall US IPO activity in the past 10 years, with 2018’s 22.5% share the lowest since 2008.

Fundraising retreats after cresting $200B in back-to-back years
Last year’s record dealmaking activity was driven by the strong fundraising environment of the past few years—a trend that 2018 didn’t continue. Fundraising set a record in 2017, with more than $224 billion raised in the second consecutive year that PE fundraising had surpassed the $200 billion mark. Things slowed significantly in 2018, with fewer funds (186 to 2017’s 235, a decline of more than 26%) and less capital ($166.4 billion, a 26% drop).

Mega-fund activity drops by half
A decline in the number of mega-funds closing was the core reason for last year’s fundraising decline. Only five closed in 2018, for a total of $52.8 billion, less than half of the previous year’s mark. That alone accounts for over 90% of the $58.3 billion overall decline in fundraising YoY. However, last year still saw some of the largest fund closures in the history of private equity. Among that group, Carlyle closed its seventh flagship fund on $18.5 billion, and Hellman & Friedman closed its ninth on $16 billion.

Private market allocations are primed to grow even larger
Over the past few years, a common theme has been LPs increasing allocations in the private markets at the expense of traditional asset classes. This is expected to continue, with the largest increases to target allocations yet to come. Per our 2018 Annual Institutional Investors Survey, respondents predict their average private markets strategy allocation will rise to 1.6 percentage points to 32.5%, with most of the increase fueled by cutting exposure to hedge funds and fixed income.

Learn about our editorial standards.
